Choosing the best energy transition solutions in 2026 is no longer a simple price comparison. Global buyers must assess cost, reliability, emissions, supply-chain resilience, and compatibility with existing infrastructure. A solar installation may look attractive on a bid sheet, but its value changes if grid access is limited or storage is missing. The details matter.
The investment signals are substantial. The International Energy Agency’s World Energy Investment 2025 estimated that global energy investment would reach $3.3 trillion in 2025, with about $2.2 trillion directed toward clean energy technologies. That includes renewables, grids, storage, and efficiency. The figures show momentum, not a guarantee of success for every project. Buyers still need to test assumptions against local tariffs, operating conditions, and financing terms.
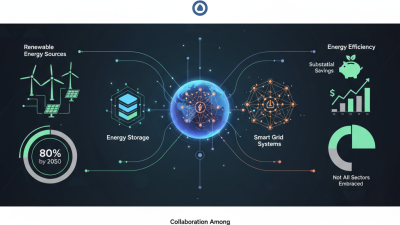
Deployment is accelerating, too. IRENA’s Renewable Capacity Statistics 2025 reported that renewables added 585 gigawatts of capacity in 2024, accounting for more than 90% of total power-capacity expansion. That is significant. Yet new generation alone cannot solve every reliability problem. This guide examines practical options for global buyers, including renewable power procurement, battery storage, electrification, energy management, and grid solutions. It focuses on measurable performance, credible supplier evidence, and project fit—not headline claims. There is no universal winner. A strong decision may still involve trade-offs, and buyers should say so plainly.
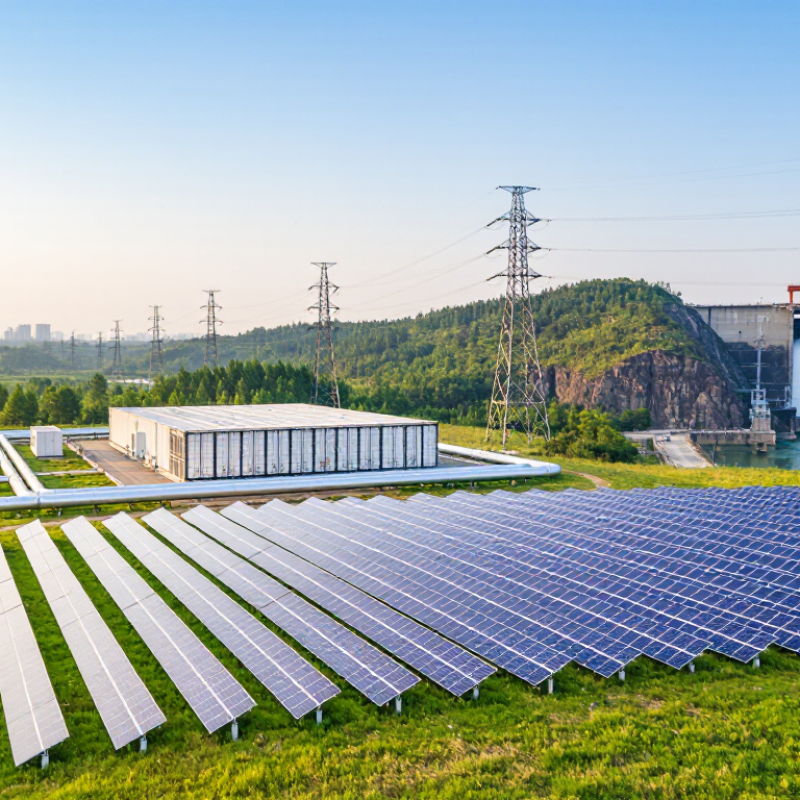
In 2023, renewables supplied 30% of global electricity. That is a significant shift, but it describes electricity—not all energy use. Transport, heating, and industrial processes still rely heavily on other sources. The global figure also hides major differences between countries and power grids.
For buyers, this baseline helps frame practical decisions. A factory can assess its hourly electricity use before choosing on-site solar, a renewable electricity contract, or efficiency upgrades. A cold-storage site, for example, may need dependable power after sunset, so storage or flexible operations could matter. No single solution fits every location. Grid capacity, local generation, and contract terms all affect results. And forecasts can change.
Tips: Request evidence for renewable electricity claims, including how generation is matched to consumption. Compare costs across seasons, not just annual averages. Ask what happens when output falls. Small details matter. The 30% figure is useful context, not a guarantee of local supply or lower emissions.
For global buyers, the roughly 460 GW of solar and wind capacity added in 2023 signals a fast-changing power market. Industry estimates put solar additions near 350 GW and wind near 110 GW. These are installed-capacity figures, not a measure of electricity produced every hour. Output still depends on weather, grid access, and storage.
Procurement teams can use this growth as a reason to compare power purchase agreements, on-site generation, and renewable certificates against their actual load profiles. Check when electricity is generated, where projects connect, and how contract terms handle price changes. A factory running night shifts may need a different mix from an office operating mainly by day. New capacity is encouraging, but it does not guarantee local supply. That gap is easy to miss.
Tips: Ask for hourly generation and delivery data, not just annual renewable totals. Compare expected output with bills from real operating months. Keep assumptions visible; forecasts can be wrong.
Battery storage additions reached 42 GW in 2023, signaling a fast-growing role for flexible power systems. Yet gigawatts measure output capacity, not how long batteries can deliver it. Buyers should also compare storage duration, location, connection timelines, and expected cycling needs.
A four-hour system can help shift midday solar into the evening peak. It may not cover a prolonged shortage or several cloudy days. The details matter. A grid operator needs dependable response, while a factory may value predictable backup and lower peak demand. Those needs call for different designs.
Before procurement, examine the local grid’s congestion, renewable generation patterns, and rules for connecting storage. Ask for performance data under realistic temperatures and operating conditions. Check how degradation could affect usable capacity over time. These questions can expose gaps that a headline capacity figure cannot show. The 42 GW figure is useful context, but it is not a measure of project quality. Storage can improve flexibility, though it cannot replace transmission upgrades or every other grid resource. Planning still gets messy. Some forecasts will be wrong, and that uncertainty deserves a place in the budget.
Buildings use about 30% of the world’s final energy, although estimates vary with boundaries and accounting methods. Much of that demand comes from heating, cooling, lighting, and hot water. A drafty entrance, an overheated office, or lights left on in an empty corridor can add up across a large property.
Efficiency is often the practical starting point. Better insulation, sealed windows, efficient heat pumps, and LED lighting can reduce demand before a building adds more electrical load. Controls matter too. A thermostat set too high in a lightly used meeting room wastes energy, while poor ventilation settings can make occupants uncomfortable. Small changes matter. But equipment upgrades need careful sizing and commissioning; an efficient system can still perform badly when its controls are misconfigured.
Electrification can replace on-site fossil-fuel heating with electric heat pumps and other electric equipment. Its climate benefit depends partly on how local electricity is generated, and a building’s wiring may need upgrades. Costs still matter. Owners must weigh energy savings against installation expense, tenant disruption, and the remaining life of existing equipment. These trade-offs are not always tidy: a deep retrofit may cut operating demand, yet the materials and labor require their own planning. A facilities team can begin with metered energy data, room temperatures, and operating schedules, then prioritize changes that fit the building’s actual use.
Announced low-emissions hydrogen projects could reach 49 million tonnes per year by 2030. That figure describes a project pipeline, not guaranteed supply. Many proposals still need financing, permits, infrastructure, and firm buyers before construction can advance. The gap matters. A project listed on a map cannot fill a storage tank.
For global buyers, the useful question is not only how much hydrogen is announced, but how much can be delivered reliably. Check expected start dates, production capacity, electricity sources, and verified lifecycle emissions. Ask how hydrogen will reach the site: by pipeline, ship, or local production. Each route brings different costs and practical constraints. A port may need new storage, while a factory may need equipment upgrades and steady supply.
Contracts should account for delays and changing volumes, rather than treating projected output as certain. Buyers can compare pilot deliveries with long-term plans and request clear reporting on emissions. This takes time. Still, the 49 Mtpa outlook signals growing interest, while leaving a difficult question: how much of that announced capacity will become dependable, low-emissions supply by 2030?